Starter quiz
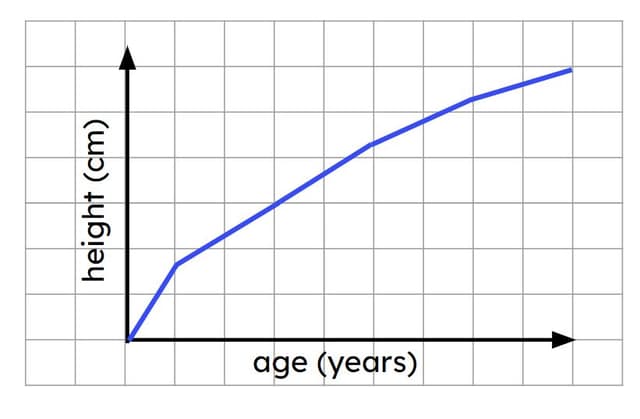
- Which of these types of diagram is a line graph?
 A
A B ✓
B ✓ C
C
- What is pollution?
- When harmful materials are put into the environment. ✓
- When people use electricity.
- When there is not enough of something to go round everyone.
- When animals, including humans, become ill.
-
- What is a person’s diet?
- The healthy foods that they eat.
- All of the foods they eat regularly. ✓
- What they eat when they are trying to reduce calories.
- The meal they have in the evening.
-
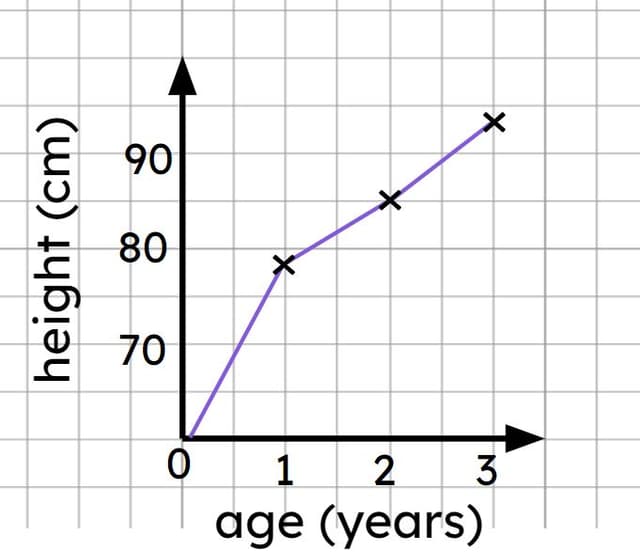
 On this graph, what is shown on the y axis?
- the age of children measured
- the height of children measured ✓
- the number of children measured
-
- Match the date to the correct name.
- 1700-1800⇔the 18th century ✓
- 1800-1900⇔the 19th century ✓
- 1900-2000⇔the 20th century ✓
- 2000-2100⇔the 21st century ✓
- Starting with the earliest, order these dates.
- 1⇔5000 BCE
- 2⇔1000 BCE
- 3⇔100 BCE
- 4⇔500 CE
- 5⇔1900 CE
Exit quiz
- The amount of time a person is expected to live is called their life ...
- 'expectancy' ✓
- Match the life expectancy of UK people in 2024 to the correct group.
- 79 years⇔men ✓
- 83 years⇔women ✓
- Which of these factors would be likely to increase a person’s life expectancy?
- having a healthy, balanced diet ✓
- getting very little exercise
- living in an area with a lot of pollution
- being able to see a doctor for any injury or illness ✓
- having access to clean, running water ✓
-
- We can find out more about life expectancy in different places and at different times by carrying out ______ using secondary sources.
- 'research' ✓
- Why would we use a line graph to represent life expectancy each century from 1200 CE to now?
- Because line graphs show changes over time. ✓
- Because line graphs are simple to draw.
- Because line graphs make it easy to find an average.
-
- Starting with the shortest, order the people according to how long their life expectancy would be.
- 1⇔A woman living in 1224
- 2⇔A man living in 1942
- 3⇔A man living in 2024
- 4⇔A woman living in 2024
Worksheet
Loading worksheet ...
Presentation
Loading presentation ...
Video
Lesson Details
Key learning points
- Life expectancy is the measure of how long a person is expected to live.
- Life expectancy varies worldwide and involves many factors.
- The average life expectancy in the UK is around 79 years for males and 83 years for females.
- Life expectancy can be researched using secondary sources of information.
- Life expectancy can be plotted on a line graph to show changes over time.
Common misconception
Pupils may think that life expectancy is a prediction for individuals or a guarantee.
Using the lesson resources to support, explain that life expectancy is a measurement we can make using data that we have about human lifespans. We cannot use it to predict how long an individual or group’s life will be.
Keywords
Life expectancy - Life expectancy is the measure of how long a person may live.
Average - An average is a number that is calculated by adding amounts together and then dividing the total by the number of quantities.
Research - To research something is to find out about it or investigate it carefully.
Line graph - A line graph is a type of diagram that can be used to show how something changes over time.
+