Starter quiz
- Which type of graph uses pictures of objects to visually represent the frequency of objects or groups.
- bar chart
- pictogram ✓
- pie chart
- scatter graph
-
- Which is a circular graph where sectors represent different groups proportionally?
- bar chart
- pictogram
- pie chart ✓
- scatter graph
-
- The ______ is the number of times an event occurs or the number of individuals (people, animals etc.) with some specific property.
- 'frequency' ✓
 Look at the bar chart. How many countries has Laura visited?
- '7' ✓
 Look at the bar chart. Which is the most common mode of travel for pupils in Year 10?
- Walk
- Bus ✓
- Car
- Cycle
- Train
-
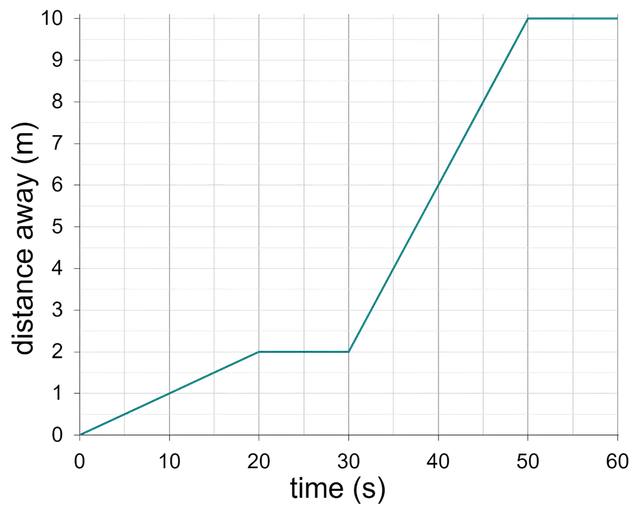
 Look at the line graph. What is the distance at 20 seconds?
- '2' ✓
Exit quiz
- Which two population pyramids show cases where the number of male and female residents is approximately equal?
- Which population pyramid shows the population whose largest age group is 30 to 34 year-olds?
- The graphs show average temperature in three towns for each month of the year. Which town is the warmest?
 Town A ✓
 Town B
 Town C
 The graph show the maximum temperature of a town for each month of the year. What was the maximum temperature in April?
- 3
- 4
- 6
- 14 ✓
- 16
-
 The graph show the maximum temperature of a town for each month of the year. Which town has a mean temperature of 16 degrees Celsius in July?
- Town A
- Town B ✓
- Town C
-
 The graph show the maximum temperature of a town for each month of the year. The mean temperature for Town A in September is ______ degrees Celsius.
- '10' ✓
Worksheet
Loading worksheet ...
Presentation
Loading presentation ...
Video
Lesson Details
Key learning points
- Data can be presented in various formats.
- A fuller picture can be obtained when considering more data.
- Multiple representations may be unnecessary.
Common misconception
Pupils may think that data is only presented using the types of graphs that they learn in school.
Data can presented visually in anyway that helps people to understand it. Explore other types of graphs and infographics used in the media.
Keywords
Bar chart - A bar chart (bar graph) is a graph consisting of bars visually representing the frequency of objects or groups.
Pie chart - A pie chart (pie graph) is a circular graph where sectors represent different groups proportionally.
Scatter graph - A scatter graph is a visual representation for bivariate data. It can help determine the nature of the relationship between the variables.
+


